Project 3 - Milwaukee Beer
Milwaukee Beer is a dashboard I created using `shinydashboard` and data that I scraped from beeradvocate.com. This dashboard can be used to compare beers brewed in Milwaukee and track customer sentiment.
shiny shinydashboard highcharterApp: https://jjohn9000.shinyapps.io/Milwaukee_Beer_App/
Introduction: Milwaukee Beer is a dashboard I built with R’s shinydashboard package – It provides quick insights into Milwaukee breweries, and beer brewed in Milwaukee. You can toggle dropdown tabs to:
- get ratings for beers and breweries
- display results in reactive, dynamic, nice graphs
- track sentiment sourced from comments / product reviews posted on beeradvocate.org
- search for beers by flavor for convenient comparison
- and even dive in to the data yourself
Feel free to search for beer by type and flavor too! Of course, Shiny is also free, unlike Tableau or any other software that come with a subscription or membership of some type.
Page 1 – Most Common Brewing Styles
- Take a look at the overall landscape of beer in Milwaukee. Get an idea of how many beers of a certain type are brewed, and which styles have a higher (average) rating.
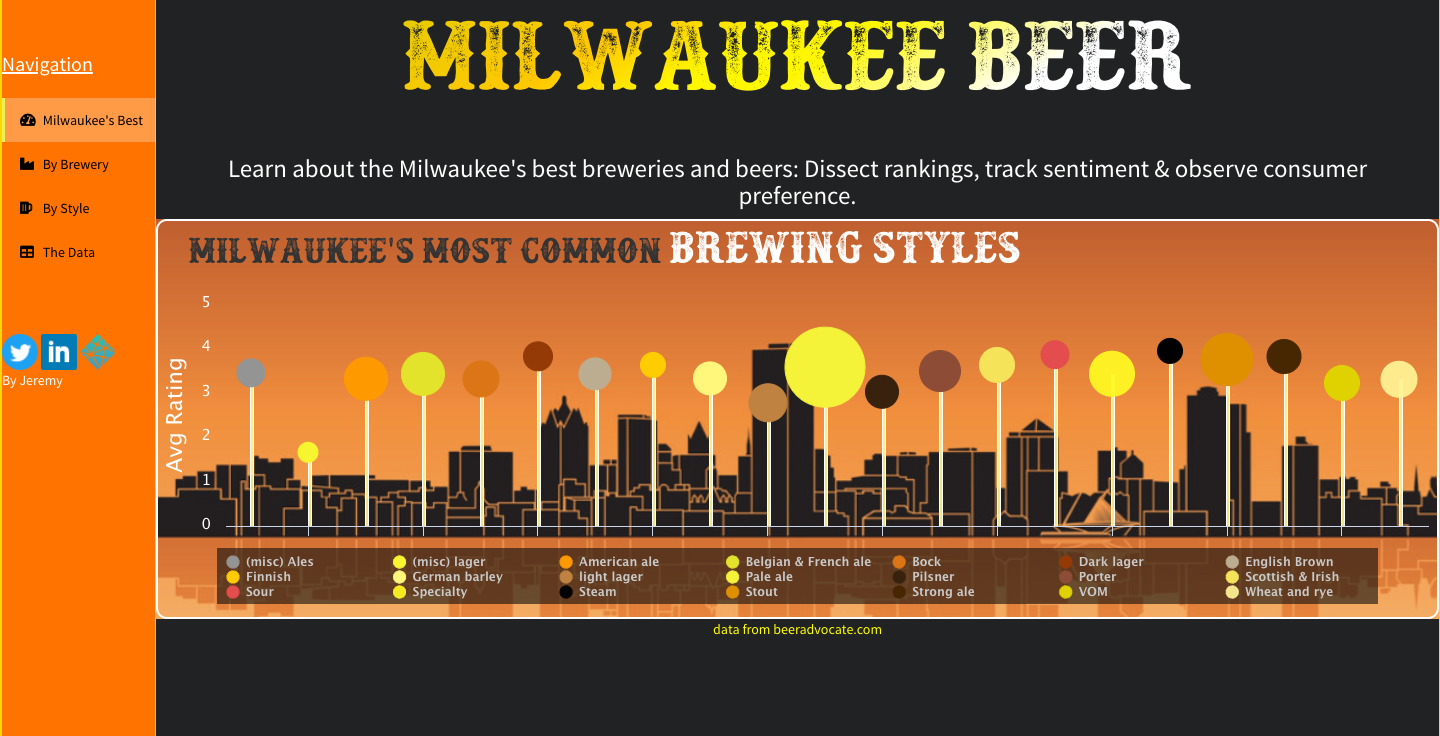
Milwaukee Beer Dashboard - Front Page
Page 2 – Milwaukee’s Breweries
- Examine over 20 breweries in Milwaukee.
- Planning a visit? Toggle dropdown to get the top 10 rated beers by a brewery.
- Observe “sentiment” expressed in reviews to see if it’s a brewery you want to avoid. (Disclaimer: There is limited comment data, but the concept is what’s important!)
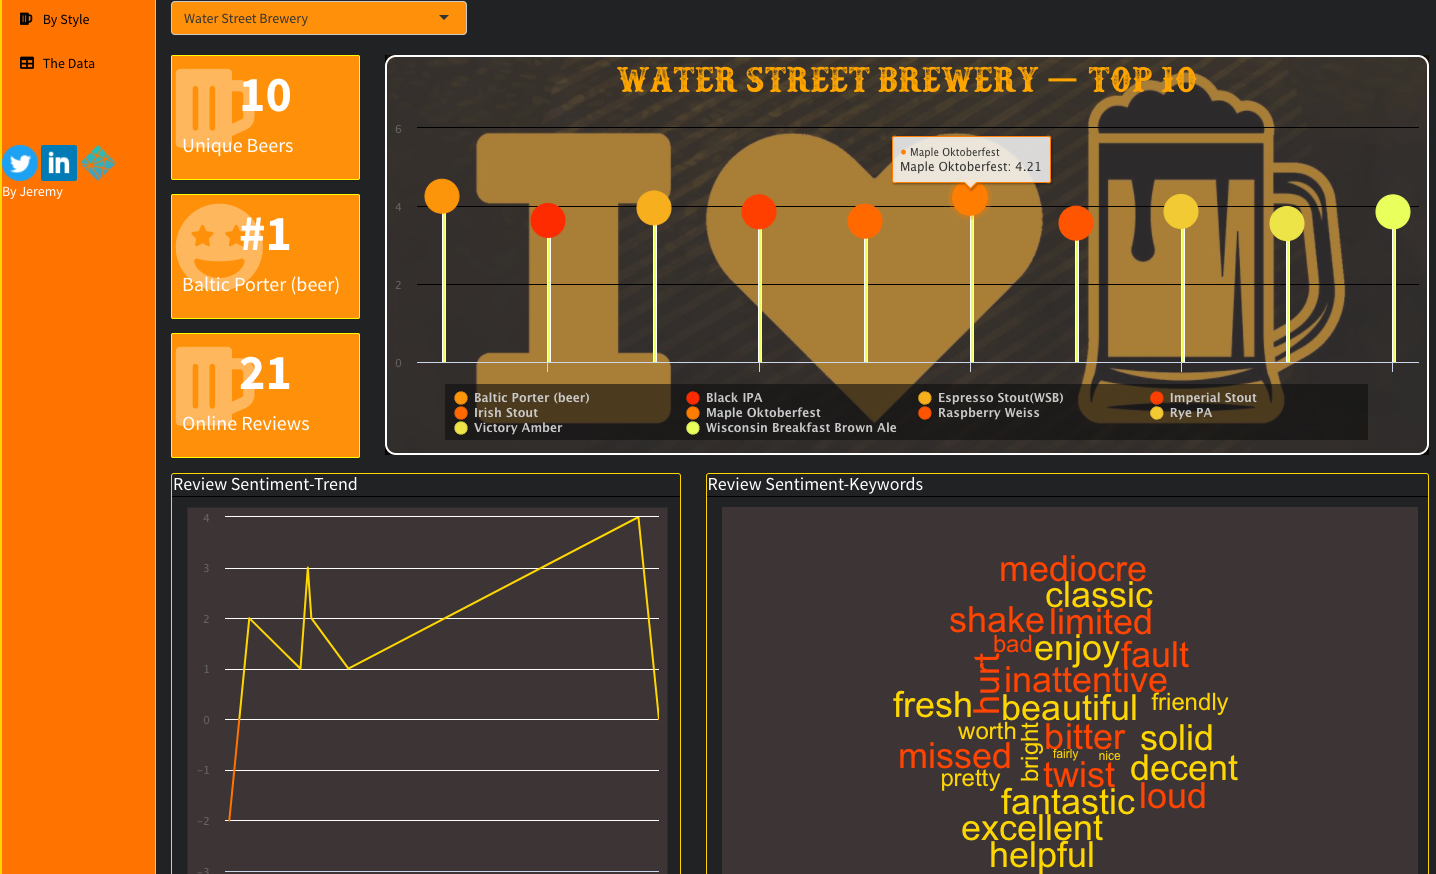
Milwaukee Beer App - Breweries Page
Page 3 – Milwaukee Beer Comparison
- Interactive “clickable” data to help you compare beers.
- Find & compare beers by searching across brewing style or flavor.
- Compare sentiments mined from customer reviews posted on beeradvocate.org.
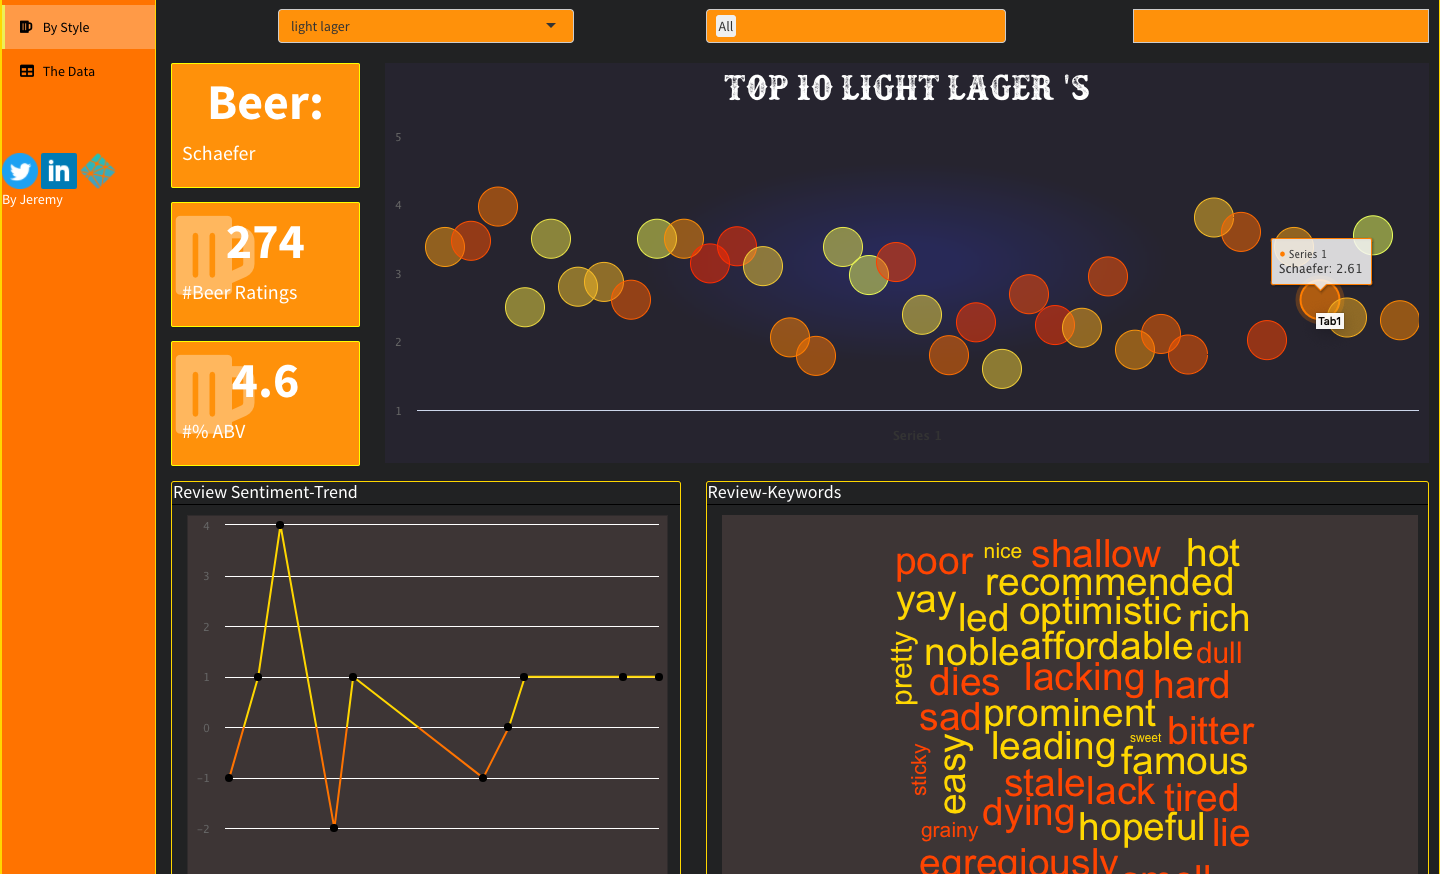
Milwaukee Beer App - Beer Page
Page 4 – Milwaukee Beer Data Table
- Data table that powers the app.
- Obtained by web scraping Milwaukee section of beeradvocate.org
- Search for any relevant terms to beer and find beers to look for on the previous pages.
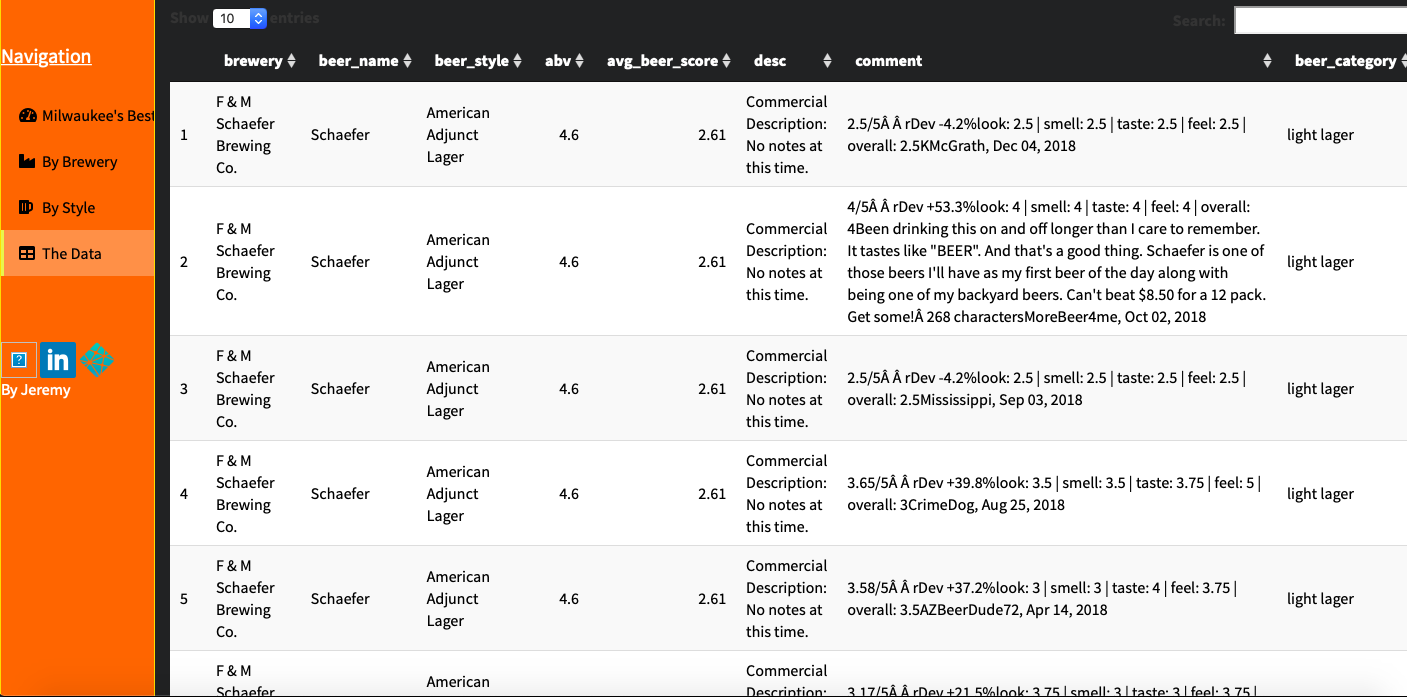
Milwaukee Beer App - Data table page
Other Comments
Before the app could even be born, I had to go out and find this data “in the wild”, weigh its relevance and potential, and identify a purpose for using it. From there on, I crafted a methodology not only to obtain the data (spread across a series of nested pages), but also determined the specific relationship (and therefore) how many tables to store the data in.
I joined tables when it made sense to do so. Additionally, I spent time cleaning on cleaning and feature engineering. Considering that this dashboard was built from the ground up, its scope wasn’t exactly trivial. Finally, branding and “feel” were important concepts. In order to make the app visually pleasing, I customized a significant amount of css code and used custom fonts.