Milwaukee Beer - Inspired by my Job Hunt
I’m excited to launch my latest Shiny app - “Milwaukee Beer” - which I made to learn shinydashboard. Due to my decision to return to the USA and hunt for a career in data, I decided to add another project to my portfolio. Milwaukee Beer is a metric tracking dashboard that provides quick insights to the unique local brews. You may toggle dropdown tabs to get rankings, nice graphs, and sentiment tracking. Feel free to search for beer by type and flavor too!
Motivation
It’s been a dream of mine to break into the data science field, so prior to my move, I decided to add another project to my portfolio – a sleek Shiny dashboard.
A brutal truth about this project was that I had to invest time in finding my own data and deciding what to do with it. Long story short, I found beeradvocate.com and scraped the Milwaukee-centric subset of it over multiple iterations to build up my dataset. I then combined the information on their local breweries, beers, and ratings/reviews.
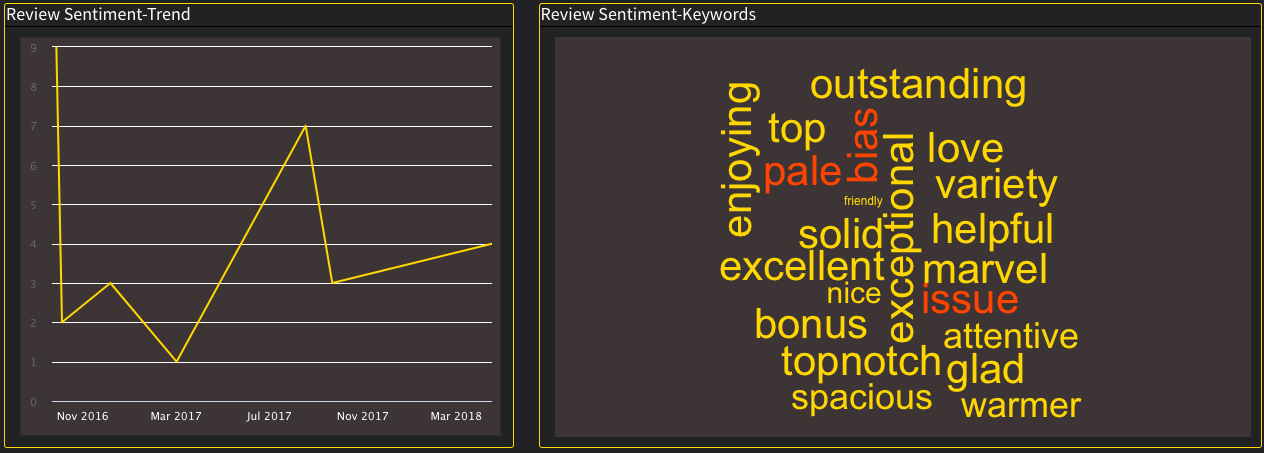
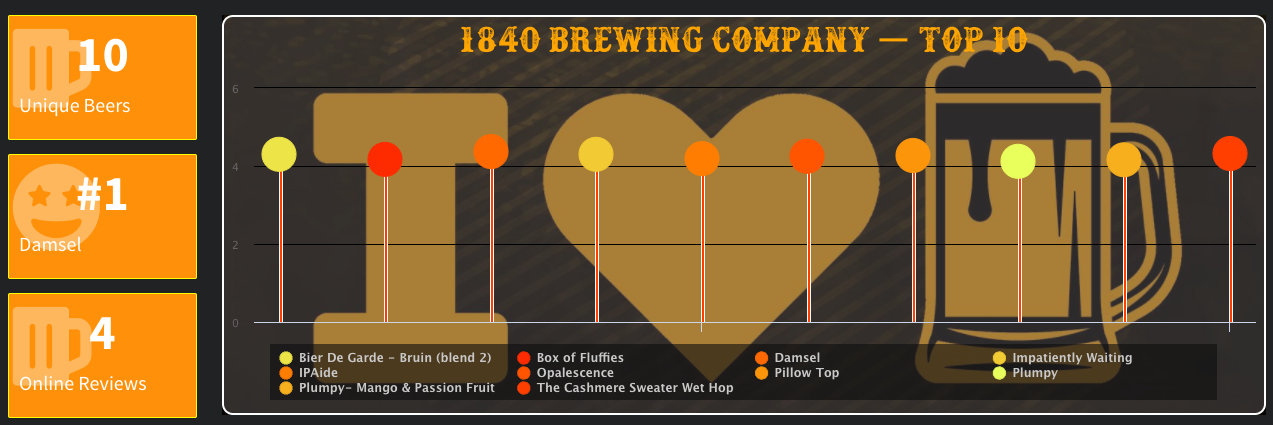
Along the way I also discovered highcharter, an amazing library for interactive plots. (If you haven’t heard of it, look it up!) First, let me provide an example of a highcharter plot I used in my dashboard. I hope it will invoke your curiosity and ultimately lure you to my app that helps explore Milwaukee’s rich array of beers!
library(tidyverse)
library(highcharter)
library(readr)

##You can find this data on my github:
## https://github.com/Jjohn987/anything_data/blob/master/public/post/milwaukee_beer3.csv

milwaukee_beer <- read_csv("milwaukee_beer3.csv")[-1]

 milwaukees_favorite <- milwaukee_beer %>%
    select(brewery, beer_name, avg_beer_score,
           beer_style,
           beer_category) %>%
   distinct() %>%
    filter(!is.na(beer_category)) %>%
    group_by(beer_category) %>%
    summarise(total = n(), avg = mean(avg_beer_score)) %>%
    mutate(id = group_indices(., beer_category))

 ## Since I want each point colored with custom colors, I need to provide a matching vector of colors.
 ##Generate pallete
colfunc <-colorRampPalette(c("#E9FF5C", "#FF8800", "#FF2B00"))
hc_colors <- sample(colfunc(nrow(milwaukees_favorite)))
So far, nothing special – just your familiar dplyr chain.
For anybody that hasn’t used the fabulous highcharter package before, add_series is similar to a geom in ggplot2, hcaes are similar to aes, and you can add tooltips, and embed html to an extent.
 highchart() %>%
      hc_add_series(milwaukees_favorite, type = 'column', hcaes(x = id, y = avg), tooltip = list(pointFormat = "{point.beer_category}: {point.avg}"), showInLegend = F) %>%
      hc_add_series(milwaukees_favorite, type = 'bubble', hcaes(x = id, y = avg, size = total, group = beer_category), tooltip = list(pointFormat = "{point.beer_category}: {point.total}"), marker = list(fillOpacity=1), minSize = 20, maxSize = 80) %>%
      hc_plotOptions(column = list(pointWidth = .5, pointPlacement = "on")) %>%
      hc_title(text = "Milwaukee's Most Common Brewing Styles") %>%
      hc_yAxis(title = list(text = "Avg Rating", style = list(color = "white", fontSize = 22)), labels = list(style = list(color = "white", fontSize = 15)), tickColor = "white", gridLineColor = "transparent") %>%
      hc_xAxis(labels = list(enabled = F), gridLineColor = "transparent") %>%
      hc_colors(color = hc_colors) %>%
      hc_chart(divBackgroundImage = 'https://i.ibb.co/S0hr0Vd/milwaukee.png',
               borderColor = 'white',
               borderRadius = 10,
               borderWidth = 2,
               backgroundColor = 'transparent') %>%
      hc_legend(backgroundColor = "#0D0D0D99", itemStyle = list(color = "#C9C9C9"), itemHoverStyle = list(color = "yellow"))
Of course, this is a teaser example to lure you to see my dashboard. Go there and explore the unique world of Milwaukee beer (in a marketing style dashboard) already!
End Note
The depth and complexity of the data were not too deep, but demonstrating visualization and tracking were my primary goals. While I’ve previously made a Shiny app that uses Halo 5’s API (yes, the game), dash-boarding has become an important skill which I felt necessary to add to my project list. If anybody in the greater Milwaukee area knows about a job relating to R, SQL, data mining, or viz, please leave me a message or add me on linked in! Contact info is hosted on this site as well as my apps.