Visualizing European WW1 Defense Treaties with iGraph
April 1, 2018
network analysis network visualization iGraph Correlates of War ProjectI suddenly got bit by a bug to learn about network analysis. So I recalled the Correlates of War Project having a dataset about alliances. I decided to revisit them and download the data for this new project, which you can do too.
To start small, I decided to visualize a certain topic, e.g., European Defense Treaties relating to World War I. For that purpose I filtered the dataset for treaties that occured between 1878 and 1914. As usual there’s a lot of cleaning to be done before anything else can be done.
library(tidyverse)
library(lubridate)
library(scales)
library(igraph)

##import data
Alliances <- read_csv("alliance_v4.1_by_directed.csv")
Data cleaning
## Create an interval object using Lubridate package to find time intervals for treaties.
Beginning <- ymd(1878, truncated = 2L)
End <- ymd(1914, truncated = 2L)
Alliance_Timeline <- interval(Beginning, End)

##Change the column names to a "From" and "To" network analysis node format, get date columns set up.
Tidy_Alliances <- Alliances %>% select(ID = version4id, CC1 = ccode1, CC2 = ccode2, From = state_name1, To = state_name2, contains("dyad"), defense, neutrality, nonaggression,entente) %>%
  unite(Start_Date, c("dyad_st_month", "dyad_st_day", "dyad_st_year"), sep = "-") %>%
  unite(End_Date, c("dyad_end_month", "dyad_end_day", "dyad_end_year"), sep = "-") %>%
  mutate(Start_Date = mdy(Start_Date), End_Date = mdy(End_Date))

##Filter for the specific years stated above, and only select European countries.
Key_Treaties <- Tidy_Alliances %>% filter(Start_Date %within% Alliance_Timeline, End_Date %within% Alliance_Timeline) %>%
  distinct(From) %>%
  filter(!From %in% c("Brazil", "Argentina", "Uruguay"))
Now that’s the basic data frame which I’m going to use to create my node and edge dataframes. This is essentially the workflow that I prefer in iGraph - processing with tidyverse tools and then passing the appropriate peices to iGraph to put it all together in its own objects. We will need an Edge list and a Node list, so let’s set ’em up.
Also it’s good to have “attributes” which can be used to make the network graph more visually informative - like edge weights, node colors, etc. I am interested in the strength of connections between nodes (aka, the edges, and I define this as number of treaties made between 2 countries for the time period) and the sides they fought on in the conflict (a node attribute).
##Create Edge data frame
Edges <- Tidy_Alliances %>%
  filter(Start_Date %within% Alliance_Timeline, End_Date %within% Alliance_Timeline, From %in% Key_Treaties$From) %>%
  group_by(From, To) %>%
  select(From, To) %>%
  mutate(width = n()) %>%
  distinct()

##Create Vertices data frame
Vertices_Weights <- Edges %>%
  select(From, To) %>%
  gather(Key, Country) %>%
  group_by(Country) %>%
  mutate(size = n()) %>%
  ungroup() %>%
  select(Country, size) %>%
  distinct()

##Create node attribute "Sides" to differentiate the factions

Sides <- c("Austria-Hungary" = "Central Powers", "Bulgaria" = "Central Powers", "China" = "Allies", "France" = "Allies", "Germany" = "Central Powers", "Greece" = "Neutral", "Italy" = "Central Powers", "Japan" = "NA",
           "Korea" = "NA", "Russia" = "Allies", "Spain" = "Neutral", "Turkey" = "Central Powers", "United Kingdom" = "Allies", "United States of America" = "Allies", "Yugoslavia" = "Allies")

Vertices <- data.frame(Country = Edges$From, Side = Sides[Edges$From], stringsAsFactors = FALSE) %>% distinct()
Now it’s time to pass the dataframes to igraph, and do the final processing there.
##Create our igraph object
Treaty_igraph <- graph_from_data_frame(d = Edges, vertices = Vertices, directed = F)

V(Treaty_igraph)$size <- Vertices_Weights$size
V(Treaty_igraph)$sides <- Sides[vertex_attr(Treaty_igraph)$name]
V(Treaty_igraph)$color <- ifelse(V(Treaty_igraph)$sides == "Allies", "cornflowerblue", ifelse(V(Treaty_igraph)$sides == "Central Powers", "olivedrab", "gainsboro"))
V(Treaty_igraph)$size <- rescale(V(Treaty_igraph)$size, to = c(10, 20))

E(Treaty_igraph)$arrow.mode <- 0

Treaty_igraph <- delete.vertices(Treaty_igraph, V(Treaty_igraph)$name[V(Treaty_igraph)$name == "United States of America"|V(Treaty_igraph)$name == "Korea"|V(Treaty_igraph)$name == "Japan"])
I rescaled the node sizes with “rescale” and I deleted the United States, Korea, and Japan nodes and edges with “delete.vertices” because they were isolated and didn’t seem relevant to any time before 1914. I’d have also deleted China for the same reason, where it not for its sole connection to Russia.
##plot our graph
par(bg="snow2")
plot(Treaty_igraph, rescale = TRUE, displaylabels = TRUE, remove.multiple = TRUE,
     vertex.label.dist = 1.75, vertex.label.cex = .8, vertex.label = V(Treaty_igraph)$name, label.cex = 2, edge.curved = .2,
     vertex.frame.color = "black", vertex.col = V(Treaty_igraph)$color, vertex.label.color = "black",
     arrow.mode = E(Treaty_igraph)$arrow.mode, edge.color = "darkgoldenrod2", edge.weight = E(Treaty_igraph)$width, main = "European Treaties 1878-1914", sub = "Defense Pacts and Ententes")
legend(x=-1.5, y=-1.1, c("Allies","Central Powers", "Neutral"),
       col="#777777", c("cornflowerblue", "olivedrab", "grey"), pt.cex=1, cex=1, bty="n", ncol=1)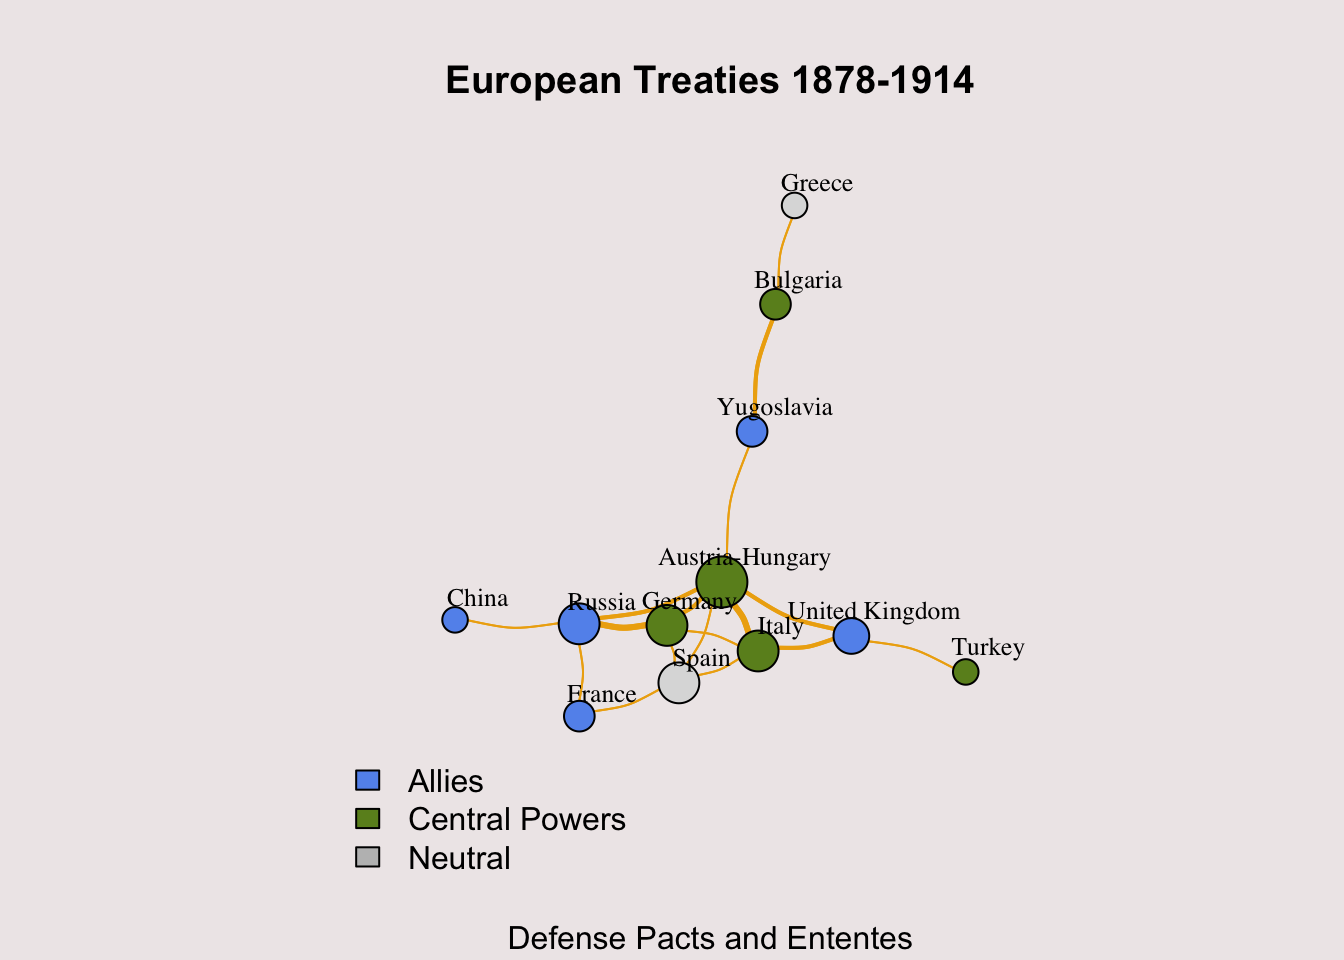
Closing
And there is my World War I network plot. We can easily see that Austria-Hungary, Germany, and Russia were the major players in power and diplomacy at the time.
I mainly wanted to get aquainted with igraph plotting (technicality) as opposed to analytical concepts (which I didn’t use here). I feel like I accomplished that goal. Of course I’d love to get more analytical with this dataset in the future. For now this will suffice, I’m sure I’ll return to this dataset though. I might even use other network analysis tools in R like tidygraph
That being said, I feel that network analysis is quite exciting and the possibilities are quite rich. I close by saying that I hope everybody enjoyed this entry and that they may find it useful or inspiring to check out igraph and other network tools in R.
Citations
Gibler, Douglas M. 2009. International military alliances, 1648-2008 (Version 4.1). CQ Press.
Zweig, K. A. (2013). Network analysis literacy: A practical approach to network analysis project design. Vienna: Springer Verlag GmbH.
This post was Migrated over from my Word Press