“Halo 5 Stats” is my first ever Shiny app, which is themed around the the popular sci-fi shooter Halo 5. It combines beatiful data with Halo’s beautiful graphics - something that Halo fans and data enthusiasts undoubtedly love. You can use my app at https://jjohn9000.shinyapps.io/Halo_5_Stats/
After entering your gamertag, the app will automatically display your online game data using Microsoft’s Halo API and visualize your data with numerous customizable elements such as backdrop and plot colors.
The app is unlike most others in that it goes beyond simply displaying text-based statistics like leadership standings and kill ratios. After all, one of R’s strengths is that ggplot2 makes data beautiful - Beautiful data and beautiful Halo graphics, something all Halo fans will love.
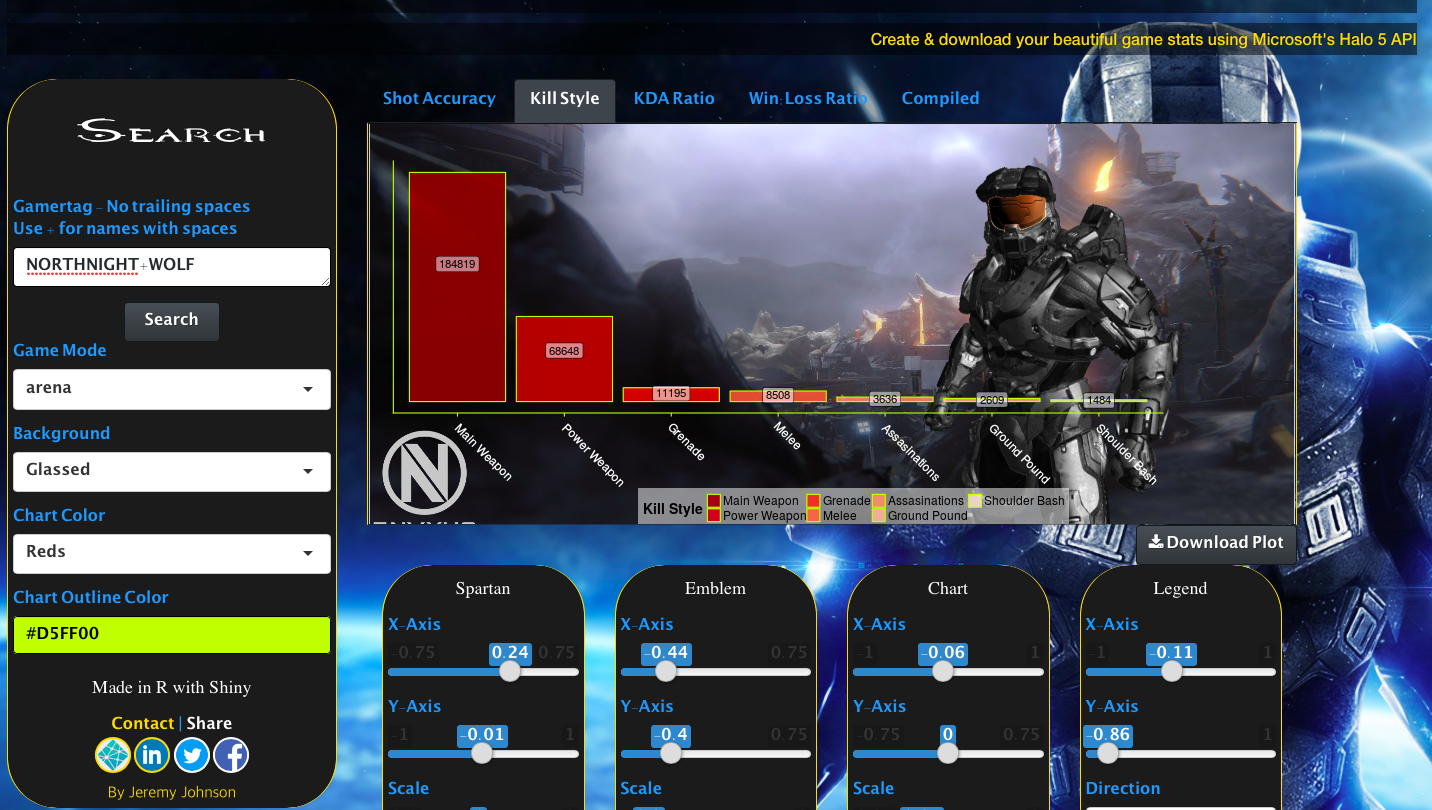
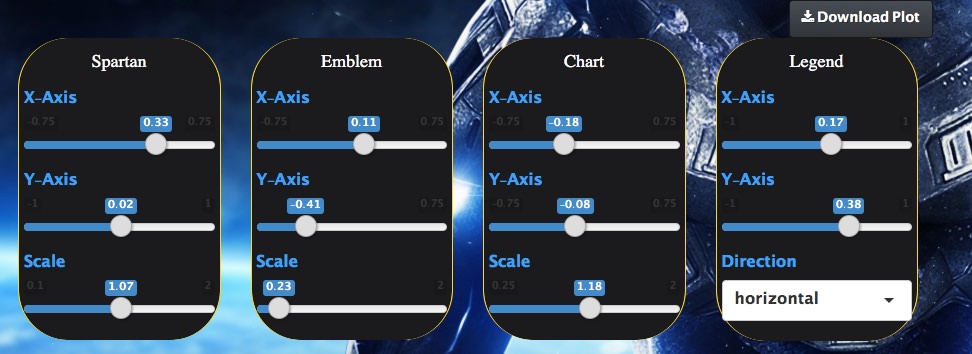
This was my first ever project in Shiny, and I learned a lot. First, I learned how to implement reactive elements in my app. But I also learned about web design, particularly Bootstrap HTML and CSS. This helped add to the overall sleek look.When you open up Halo 5 Stats you will see a lot of these implementations - numerous reactive elements, say, futuristic styled paneling.
Please give my app a look and enjoy it! Download plots and share with your friends or save a plot as a wallpaper - whatever you enjoy! Here’s an example of the previous plot, downloaded.
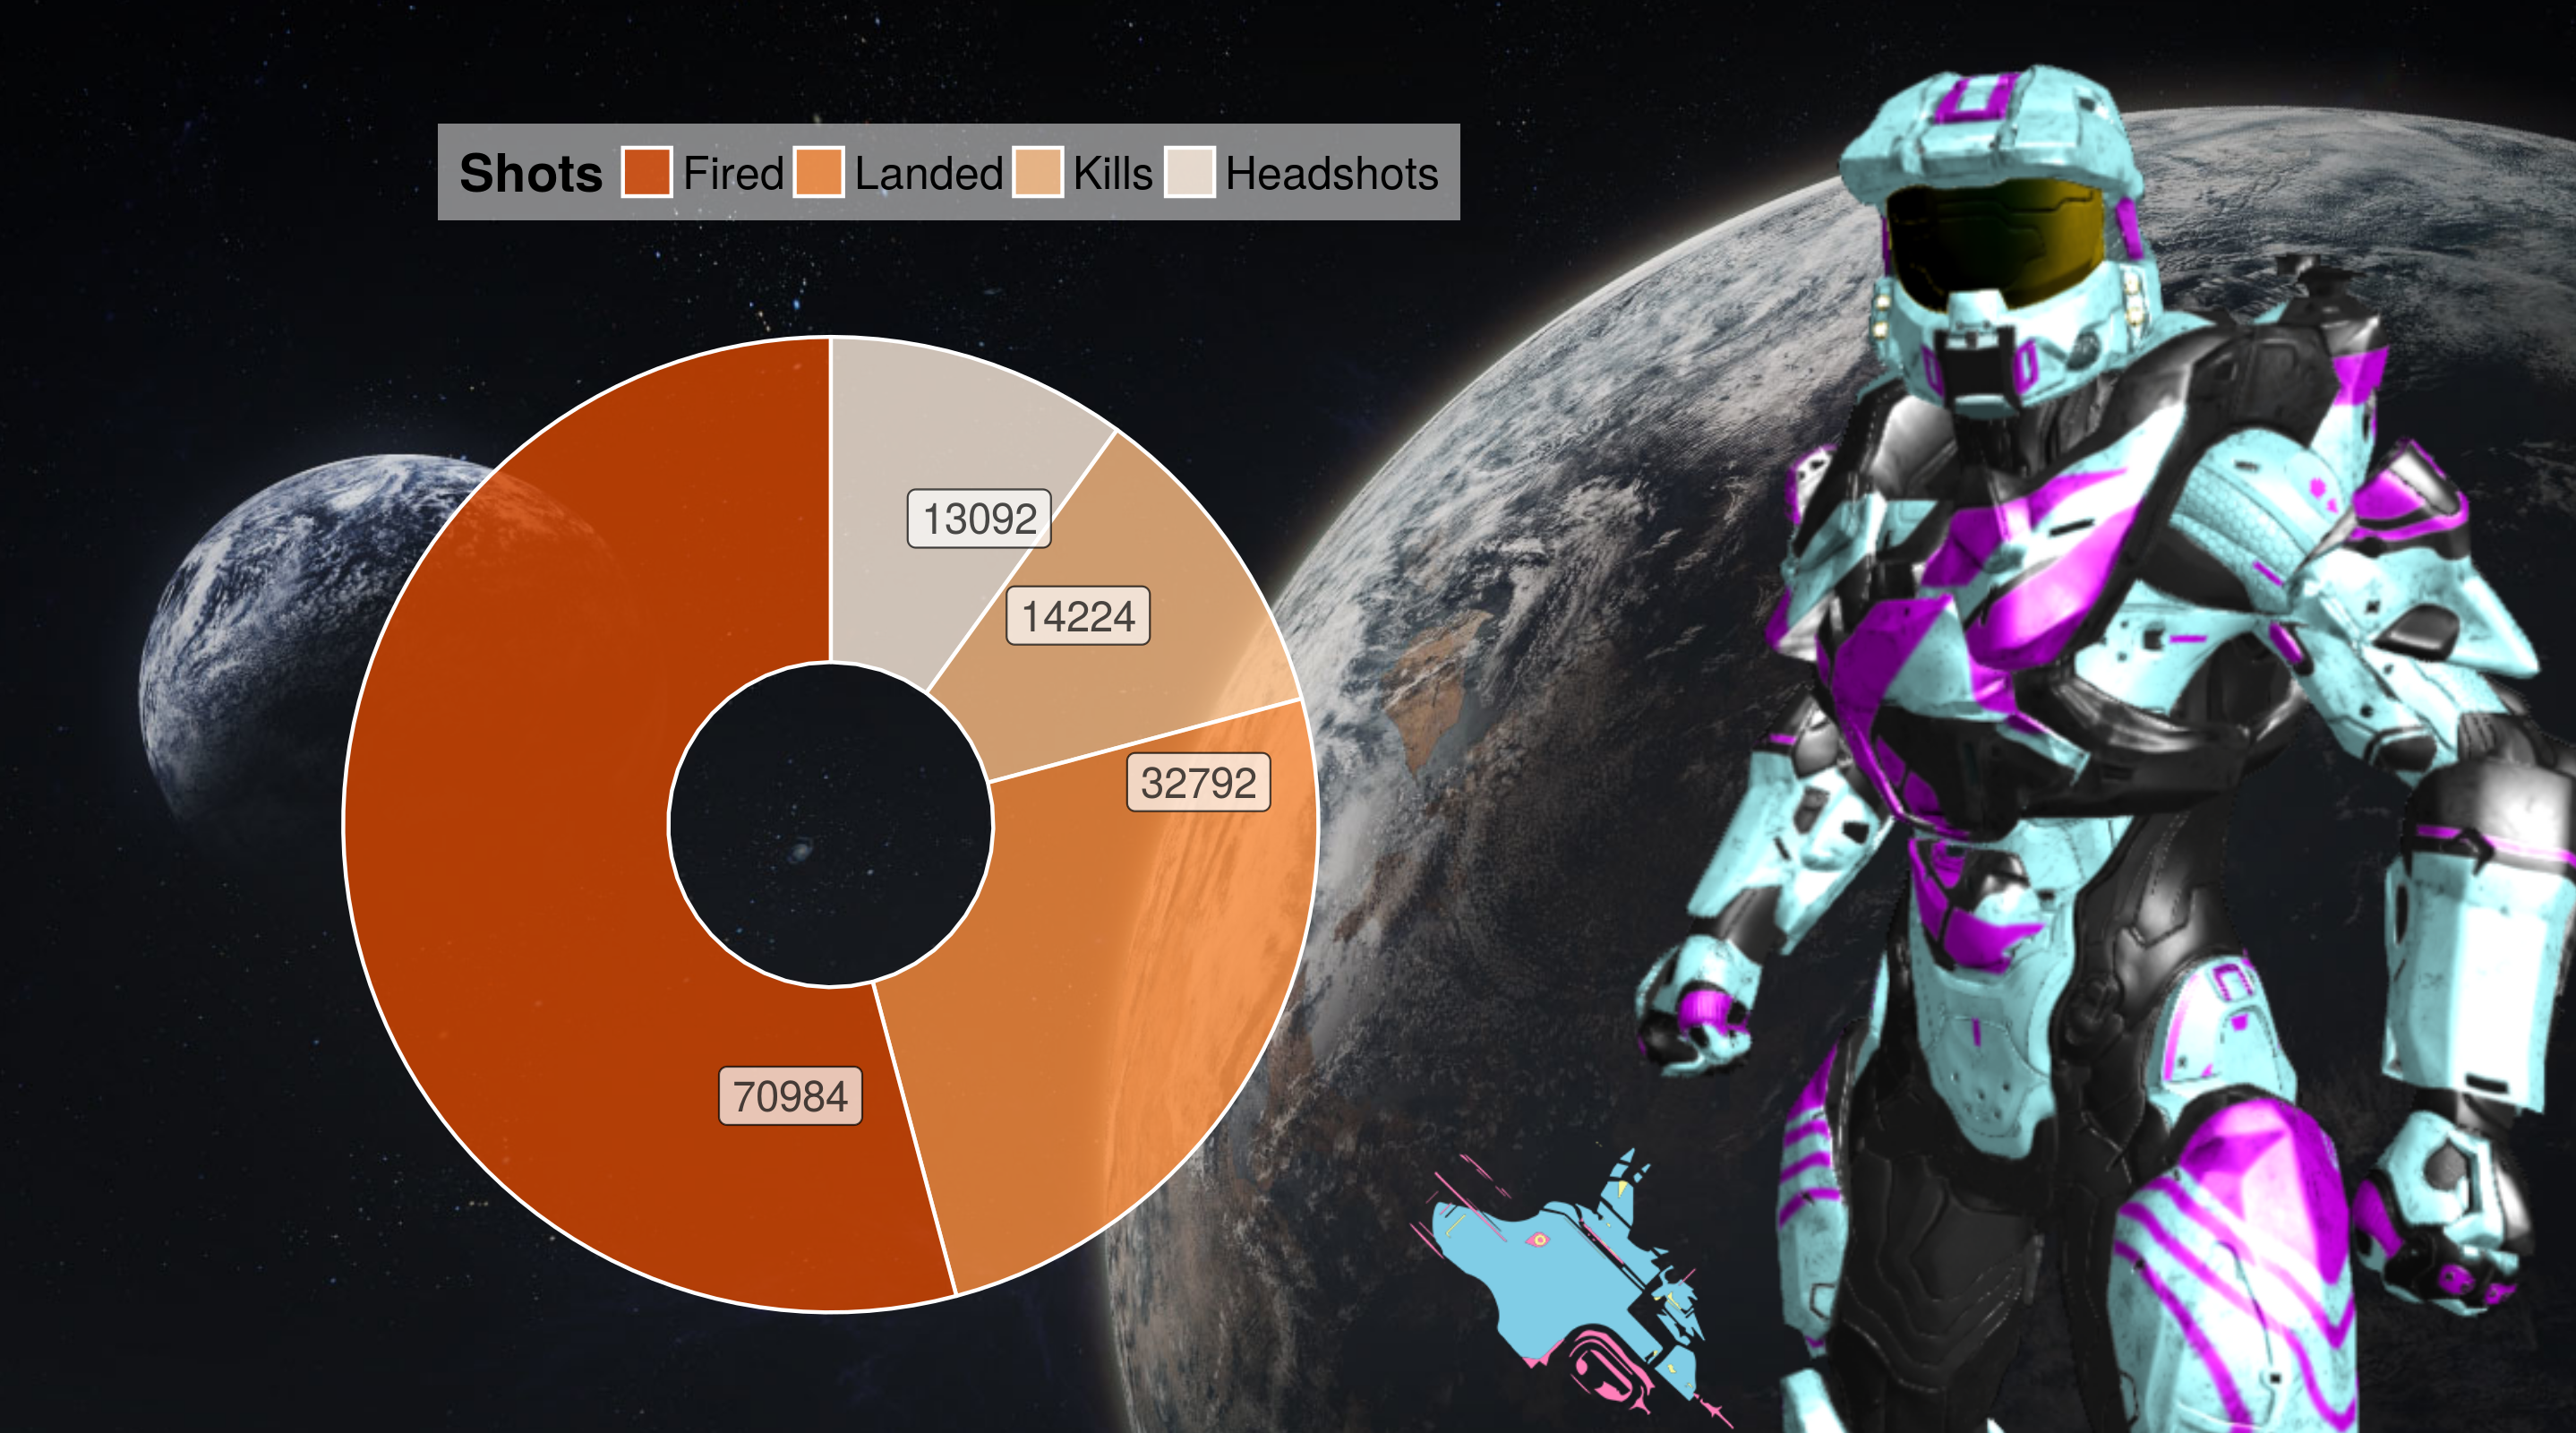
Give the app a try, and if you use it, please share it on social media! You can even look up my own gamertag for fun - (Hairball9000)! Remember, it is located at this web address:
https://jjohn9000.shinyapps.io/Halo_5_Stats/